Introduction
Sound, noise and quiet
Definitions and selection criteria
Health benefits of quiet & biodiversity
The economic value of quiet areas
Lessons learned from commitments by MS and other competent authorities
Methods for identifying quiet areas
Recommendations and Conclusions
More on:
- references & useful documents and links
- health effects
- quiet facades
- protection and monitoring
Disclaimer: this site is based on the published EEA document, but not identical. Over time the differences will increase as more recent material will be added to this site by Chiaramonte Consult. Please send your comments and suggestions for extensions and improvment to info@quietareas.eu.
Methods for identifying quiet areas
chiefly member states use four complementary methods for identifying quiet areas:1 noise mapping by modelling calculations
2 actual measurements of sound-pressure levels in situ
3 valuation of user/visitor experiences i.e soundscape approach
4 expert assessments
Below the benefits and limitations of these methods are examined
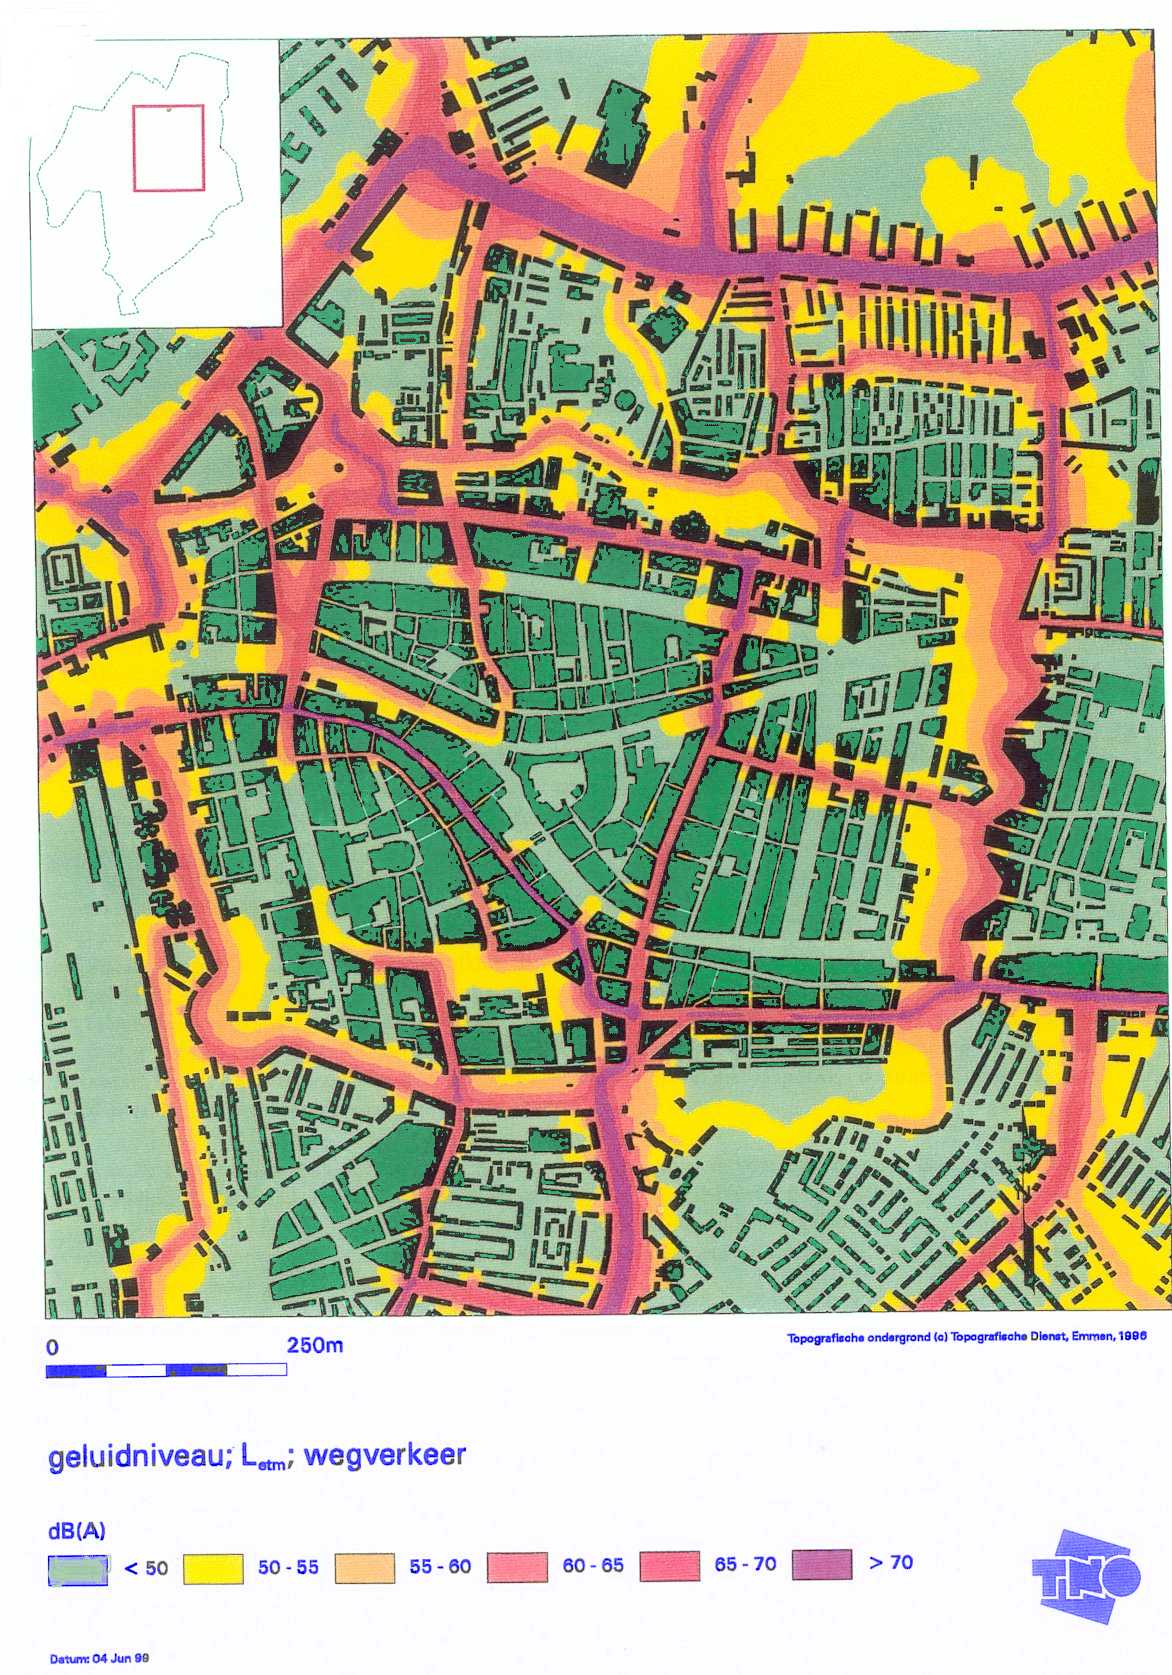
8.1 Noise mapping
As stated in the introduction, the idea of preserving quiet areas originates in the development of noise maps. Such maps can be used to identify areas that are not exposed to calculated sound-pressure levels from environmental noise above a given magnitude. A common European method for assessing noise is under development (Kephalopoulos, Paviotti & Anfosso-Lédée, 2012).
Benefits
· Noise
maps provide an easily interpreted visual presentation of the
distribution of
calculated sound-pressure levels from given noise sources, such as
traffic or
industry, in a given region, and for a defined period.
· Calculation
of sound-pressure levels are more cost-efficient than actual
measurements,
particularly if a large area is to be mapped, because it is necessary
to have many
measurement or receiver points.
· Noise
maps present calculated sound-pressure levels from environmental noise,
separated
from other sources. Please observe that the definitions of ‘quiet area’
in the
END presuppose that this distinction is possible in practice.
· Noise
maps are particularly useful when planning a new area. At the planning
stage
actual measurements are not possible, because the noise sources, like
roads and
vehicles, do not yet exist in the area.
· Noise
maps are based on mathematical models of how environmental noise
propagates
outdoors under given and restricted conditions. Deviations from the
given
criteria results in calculated sound-pressure levels that do not
correspond to
reality. Examples of factors that may influence the results are
topography, architecture,
weather, as well as façade and surface material. Noise maps must be
validated
by actual measurements.
· Noise
maps are typically based on one noise source at a time (road traffic,
railway
traffic, aircraft, or industry). It is important to calculate the net
effect of
sound-pressure levels from multiple and simultaneous noise sources,
else the sound-pressure
levels may be underestimated.
· Noise
maps do not include positive sounds, like wind in trees, purling water
or
birdsong.
· Noise
maps identify quiet areas based on calculated sound-pressure levels.
One must
keep in mind that an area which is undisturbed by environmental nose,
for
example a marsh land, may not necessarily be valuable to human health,
when
considering other aspects than environmental noise.
· Noise
maps typically present calculated A-weighted sound-pressure levels.
These
values do not provide an accurate representation of how people perceive
the
acoustic environment, not even with regards to loudness (e.g., Nilsson,
2007a,
2007b). Sound provides a lot more information to human beings than
magnitude.
The COST members
have in the last several years developed techniques and concepts to
produce
alternative maps (see web of the soundscape COST Action: http://www.soundscape-cost.org/,
as well as relevant publications by the COST members), including
· sound maps, which include both noise
(e.g.
traffic
noise) and positive sounds
· psychoacoustical maps, where
psychoacoustical
parameters like sharpness etc can be mapped
· soundscape
maps based on the
previously
surveyed
soundscape evaluation, using artificial neural network techniques (Yu
and Kang,
2009).
8.2
Measurement of sound-pressure levels
Besides calculating the
sound-pressure
levels, many authorities measure the actual levels in situ. These
measurements
are typically used to complement or to validate the noise maps.
Benefits
· Measurements
provide the actual sound-pressure levels at a given place at a given
time, and
may better reflect reality than models and calculations. Under
conditions for
which calculation models do not apply, this is the only method to
obtain accurate
sound-pressure-level data. For a long time the calculation models could
not
accurately predict the sound-pressure levels in court yards enclosed by
buildings. As noise mapping evolves, new similar limitations will
likely be
discovered.
· To
measure sound-pressure levels is time consuming, labour intensive and
costly,
particularly if a large area is to be mapped, using many measurement
points.
· Presently,
measurements cannot distinguish sound-pressure levels from different
sources,
and measure environmental noise separately. This is particularly
important to
quiet areas. The actual measurement is a mixture of sound-pressure
levels from
various sources, including the sounds of the place – such as sounds of
people,
wind in vegetation and flowing water – and environmental noise. This
means that
there is a risk of a mismatch between calculated and actual
sound-pressure
levels, and that measurements cannot be used to validate the calculated
levels
of environmental noise in a quiet area. Please observe that the
definitions of
‘quiet area’ in the END presuppose that it is possible to distinguish
environmental noise from other sources.
· Measurements
are typically based on A-weighted sound-pressure levels. These values
do not
provide an accurate representation of how people perceive the acoustic
environment,
not even with regards to loudness (e.g., Nilsson, 2007a, 2007b). Sound
provides
a lot more information to human beings than magnitude.
The purpose of preserving quiet
areas is to
protect human health. This includes protecting people from noise
annoyance and
sleep disturbance, which are psychological factors that cannot be
measured with
physical measuring instruments. Thus, it is essential to know how
people
perceive quiet areas. This insight in combination with the limitations
of
calculated and measured sound-pressure levels, particularly with
regards to
quiet areas, have fuelled the interest in soundscape studies. The
launch of the
European Soundscape Award, sponsored by the European Environment
Agency,
underlines the progress and importance of the soundscape approach in
· Only evaluation
of user/visitor experiences can provide insight into how people
perceive a
quiet area. Such studies may include, but are not limited to,
perception of how
dominant different sound sources are, perceived acoustic quality or
appreciation,
tranquillity, annoyance, what sounds are appropriate to the place,
recreational
value and actual use of the area.
· In
contrast to present sound-level meters, human beings can distinguish
the
intensity of sounds from different sources, like technology, humans and
nature.
Such measurements have repeatedly been proven to be a stronger
predictor of
perceived acoustic quality in an area than A-weighted sound-pressure
levels
(e.g., Nilsson, 2007a, 2007b).
· Perceived
acoustic quality is not limited to the acoustic environment per se, but
also
influenced by the visual quality of an area. A lush and green
environment may
increase perceived acoustic quality and reduce annoyance, even though
greenery has
a limited influence on sound-pressure levels. Physical measuring
instruments
cannot capture such psychological effects.
· Evaluation
of user/visitor experiences is typically conducted by questionnaire
surveys in
situ. This method is weather dependent in that it is hard to conduct
surveys
when the weather is bad (rain, wind, cold). On the other hand, people
are reluctant
to visit quiet areas during bad weather conditions, and there is no
point in
conduction user/visitor surveys when there are no visitors.
· Like
measurements of sound-pressure levels, evaluation of user/visitor
experiences
is time consuming, labour intensive and costly. They require time for
preparation and to develop appropriate questionnaires. Typically they
require a
relatively large staff, and time to collect the questionnaires. They
also
depend on the visitors’ willingness to participate in the survey. After
data
collection, the date must be processed, which requires both time and
skill.
· Evaluation
of user/visitor experiences requires expertise in behavioural science
in order
to develop appropriate questionnaires. The quality of the data depends
on the
developer’s skills and experience in the field, particularly soundscape
and
environmental psychology.
· As of
yet, there are no standardised methods for evaluation of user/visitor
experiences of quiet areas. Such standards, like a standardised
questionnaire,
would make this method more available to non-experts.
As stated above, identification of
quiet
areas by sound-pressure levels is limited in that an area which is
undisturbed
by environmental noise may not necessarily be valuable to human health,
when
considering other aspects than environmental noise. For this reason it
is
important to include other criteria, besides sound-pressure levels.
Such
criteria may include land-use plans, cultural heritage, ecological
values,
social and recreational values, and accessibility. Assessment of such
criteria
typically requires expertise.
· Expert
assessments of a potential quiet area contribute with valuable insights
on
other aspects of the area than sound-pressure levels. Experts may
include urban
planners, landscape architects, sociologists, biologists,
psychologists, and
antiquarians, as well as acousticians.
· Involving
experts, who contribute with different points of views early in the
process,
helps to achieve an appropriate outcome faster, than if only a limited
set of
criteria, like sound-pressure-level data from noise mapping, is
considered.
· Skilled experts
are in short supply.
· Like
sound-pressure-level data, expert assessments do not provide
information on how
users/visitors experience a quiet area.