Introduction
Sound, noise and quiet
Definitions and selection criteria
Health benefits of quiet & biodiversity
The economic value of quiet areas
Lessons learned from commitments by MS and other competent authorities
Methods for identifying quiet areas
Recommendations and Conclusions
More on:
- references & useful documents and links
- health effects
- quiet facades
- protection and monitoring
Disclaimer: this site is based on the published EEA document, but not identical. Over time the differences will increase as more recent material will be added to this site by Chiaramonte Consult. Please send your comments and suggestions for extensions and improvment to info@quietareas.eu.
Several authorities have made a conscious effort to promote or protect quiet areas. Although – as stated before – approaches vary because of cultural differences including language differences and difficulties in translating ‘quiet area’) and the still limited experience from quiet areas much can be learned from these efforts.
|
Table 3 . Action Plans and Policy papers with a focus on Quiet Areas |
||||||
|
Name of principal location |
Level authority 1) |
Type 2) |
Indicator |
Value (dB) |
Selection method |
Observations |
|
|
Ag |
AP |
% area > Lden |
<55 |
●
Discussion with key persons in the City of ●
Review of registered green areas and meeting
places in ●
Use of the result of the noise mapping ●
Site visits, use of the registration schedule ●
Discussions with representatives from city
districts and special interest organisations |
Of 77 potential areas 14 selected. Additional
criteria number of inhabitants < |
|
|
Ag |
AP |
Lden |
<55 |
Acoustic Natural and recreational areas ● ● ● > 5 dB difference between centre and margin inside agglomerations |
5 areas outside agglomeration.
Total |
|
|
MS |
PP |
- |
- |
●
Accessibility ●
Quantity
– amount of provision of quiet open space
– measure using count, area (or time?) ●
Quality – appropriateness
for purpose ●
Multi-functionality / Primary purpose |
|
|
|
Ag |
AP |
Lden |
<55 |
●
Demographical – people’s density, ●
Land-use plans with maps for transportation
net development, ●
Spatial management, taking into consideration ●
Guides for future land-use planning and
spatial management ●
Nature preservation areas, especially areas of
the Nature 2000 net |
|
|
|
MS |
PP |
- |
- |
●
Ecological infrastructure (EHS) ●
Sound quality fitting for function of area |
Monitoring actions (for the Treasury) show that
70% of the EHS-areas are over 39 Lden
(translation of LAeq,24h of 40 ). Stand still
(2000-2010) reached. |
|
|
Re |
AP |
LAeq,24h? |
40 |
●
Sites of natural and cultural interest ●
Acoustic |
31 areas covering |
|
Flevoland (NL) |
Re |
AP |
LAeq,1hr |
35 |
●
Acoustic ●
Recreational value ●
Nature area |
Monitoring of % quiet
area over indicator |
|
(NL) |
Re |
AP |
|
|
Sites of natural and cultural interest ●
Acoustic |
There are 15 true quiet
areas and about 5 quiet policy areas.
The largest (20
x |
|
|
Ag/RI |
AP |
Lday, Levening |
60 |
●
Acoustic ●
Surface > ●
Open access ●
Recreational/cultural value ●
Approved by city council |
The use of L95-L5
is considered as an indicator |
|
|
Ag |
AP |
Lden |
50 |
|
|
|
|
Re |
PP |
Lden |
55 |
●
Acoustic ●
Minimum area of |
Quiet areas included in action plans |
|
|
Re |
PP |
Lday(?) |
55 |
●
Natural rather than mechanical sounds are
favoured. ●
Visual quality can enhance ‘quietness’ or
tranquillity. ●
Size as such is immaterial – small spaces in
inner cities can have high value in terms of providing respite,
opportunity for relaxation and exercise. ●
Attitudes to what constitutes quiet are to
some extent determined by culture and location. ●
The WHO guideline of 55 dB(A) has been taken
as a starting point for looking at the designation of quiet areas. ●
A substantial part of a space being at least 6
dB below the typical daytime level of its surroundings might be a
practical early guideline. |
Position paper
contains checklist to assess “tranquillity”. Items are:
soundscape, presence of nature, visual or aesthetic
quality, sense of personal safety, culture and freedom. |
|
|
Ag |
AP |
LAeq,1min LAeq,15min |
|
●
Understanding noise environment ●
Understanding the view of visitors ●
Coordinating approach QA’s with other
initiatives |
Special projects which may feed into quiet area: -iconic sounds of the city -city sound walk -area based initiatives |
|
|
Ag |
AP |
LAeq,day LAeq,night |
|
Quality level of function is leading; relevant
classes: ●
Class I: special protected areas- hospitals,
schools, recreational areas, special urbanistic areas: 45 Lday,
35 Lnight ●
Class II: low density residential : 50 Lday,
40 Lnight |
Measures for quiet
areas will be integrated in hotspot-measures of action
plan. |
|
Czech
Rep. |
MS, RI |
PP |
Lday, Lnight |
40, 40 |
Land use plan: natural parks and protected
landscapes. ●
Luxury- Lday & Lnight
< 40 ●
Comfortable: Lday < 50, Lnight < 40 ●
Good: Lday < 55, Lnight
< 45 ●
Acceptable: Lday
<
60, Lnight < 50 ●
Unfavourable: Lday > 60, Lnight > 50 |
Quiet areas in agglomerations may include Luxury and
Comfortable areas |
|
|
MS |
PP |
LAeq |
25 |
Determine acoustic landscape Determine positive experienced sounds Determine negative experienced sounds Assess overall acoustic quality on a scale Class A: freedom of noise < 25 dB. 1-2
events
< 5 minutes/week Class B: <
35 dB. 3-4 events <
5 minutes/day Class C: <
45 dB. 60-120 events <
1hour/day Class D: <
45 dB. 120-240 events <
2 hours/day Class E: <
50 dB, or 10-20 dB below
surroundings |
|
|
|
Re |
PP |
|
|
|
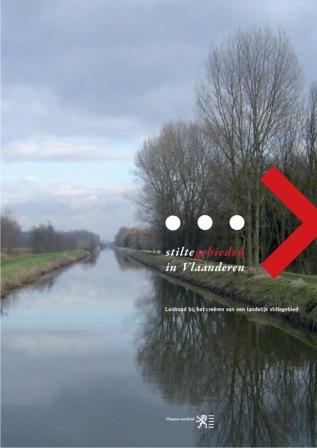
Leaflet with instructions to derive quiet areas. See Dender-Mark area for content. |
|
Dender-Mark
area (Be) |
Re |
AP |
L50, 15min Lnight |
45 30 |
●
L50 value of not area
specific sounds ●
Lnight value of not
area specific sounds ●
Visitor’s score of quietness ●
% of time that non area sounds are perceived ●
Perception of non area specific sounds ●
Number of non area specific events per 15 min. ●
Perceived appropriateness of area sounds ●
Geographic cohesion ●
Natural or cultural value of landscape |
The acoustic quality of an area must be
guaranteed 80% of the year (anywhere) and any day in at least 80% of
the area. |
1) Ag=agglomeration, MS=
2) AP=Action Plan, PP=Position Paper
The more complex methods (
The
simpler approaches (just Lden)
can be
effective in quiet areas in
open country, because in
open country loud sounds are more likely to originate from sources like
traffic, industry or recreational activities. Thus, if sound-pressure
levels
are below a certain level (e.g., < 40 dB) on a calm day, the
area is
probably free of such sources. The Dutch
regions laid
down special
regulations in which regional inspectors get the right to control noisy
activities before they occur (like a planned motor bike tour),
or once they are perceived. Such a mechanism seems to be missing or is
not made
explicit in other plans.