Introduction
Sound, noise and quiet
Definitions and selection criteria
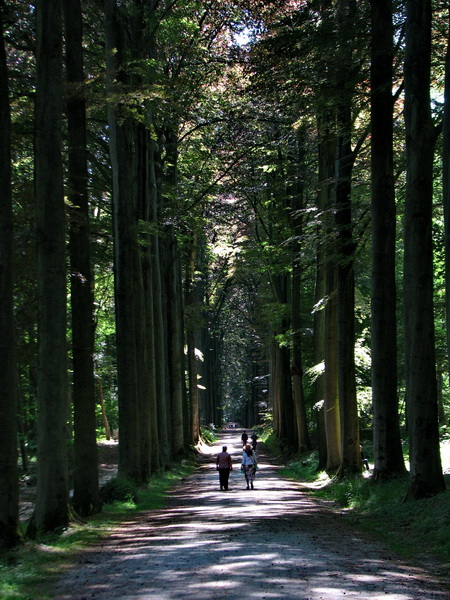
Health benefits of quiet & biodiversity
The economic value of quiet areas
Lessons learned from commitments by MS and other competent authorities
Methods for identifying quiet areas
Recommendations and Conclusions
More on:
- references & useful documents and links
- health effects
- quiet facades
- protection and monitoring
Disclaimer: this site is based on the published EEA document, but not identical. Over time the differences will increase as more recent material will be added to this site by Chiaramonte Consult. Please send your comments and suggestions for extensions and improvment to info@quietareas.eu.
Effects on health and well being related to Quiet Areas
The Good Practice Guide on noise exposure and potential health effects provides an overview of the adverse effects of noise. It is pretty obvious that quiet areas in urban settings reduce the chances of exposure to noise and so reduce the effects. The dose-response relations in this GPG can be provide quantative insights. This section however concentrates on additional effects of quiet areas, as well in urban as in rural areas. This may also be of assistance in the defiition of QA's: when do people consider an area - reasonably - quiet? And what indicators can be used to assess that?The next topics are considered:
1. Expressed preference for quiet areas and other population markers.
2. Revealed annoyance or quality judgements in relation to sound levels
3. Indicators
4. Additional benefits
1. Preferences for quiet
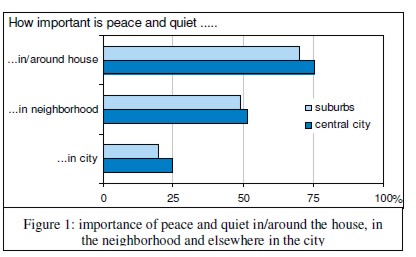
In the city of Amsterdam, it was found that a lot of people appreciate quiet in and around the house.
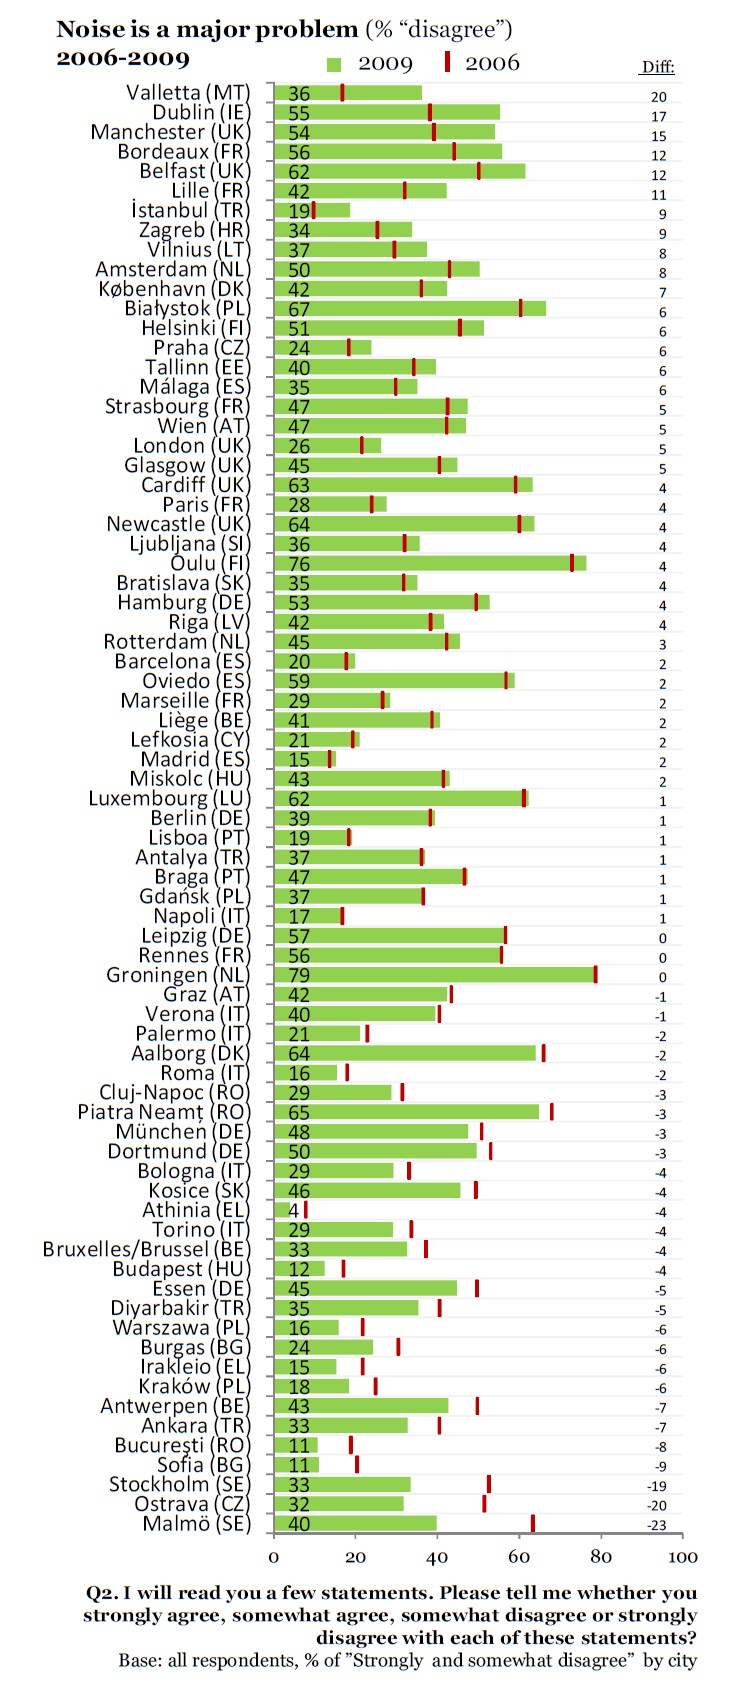
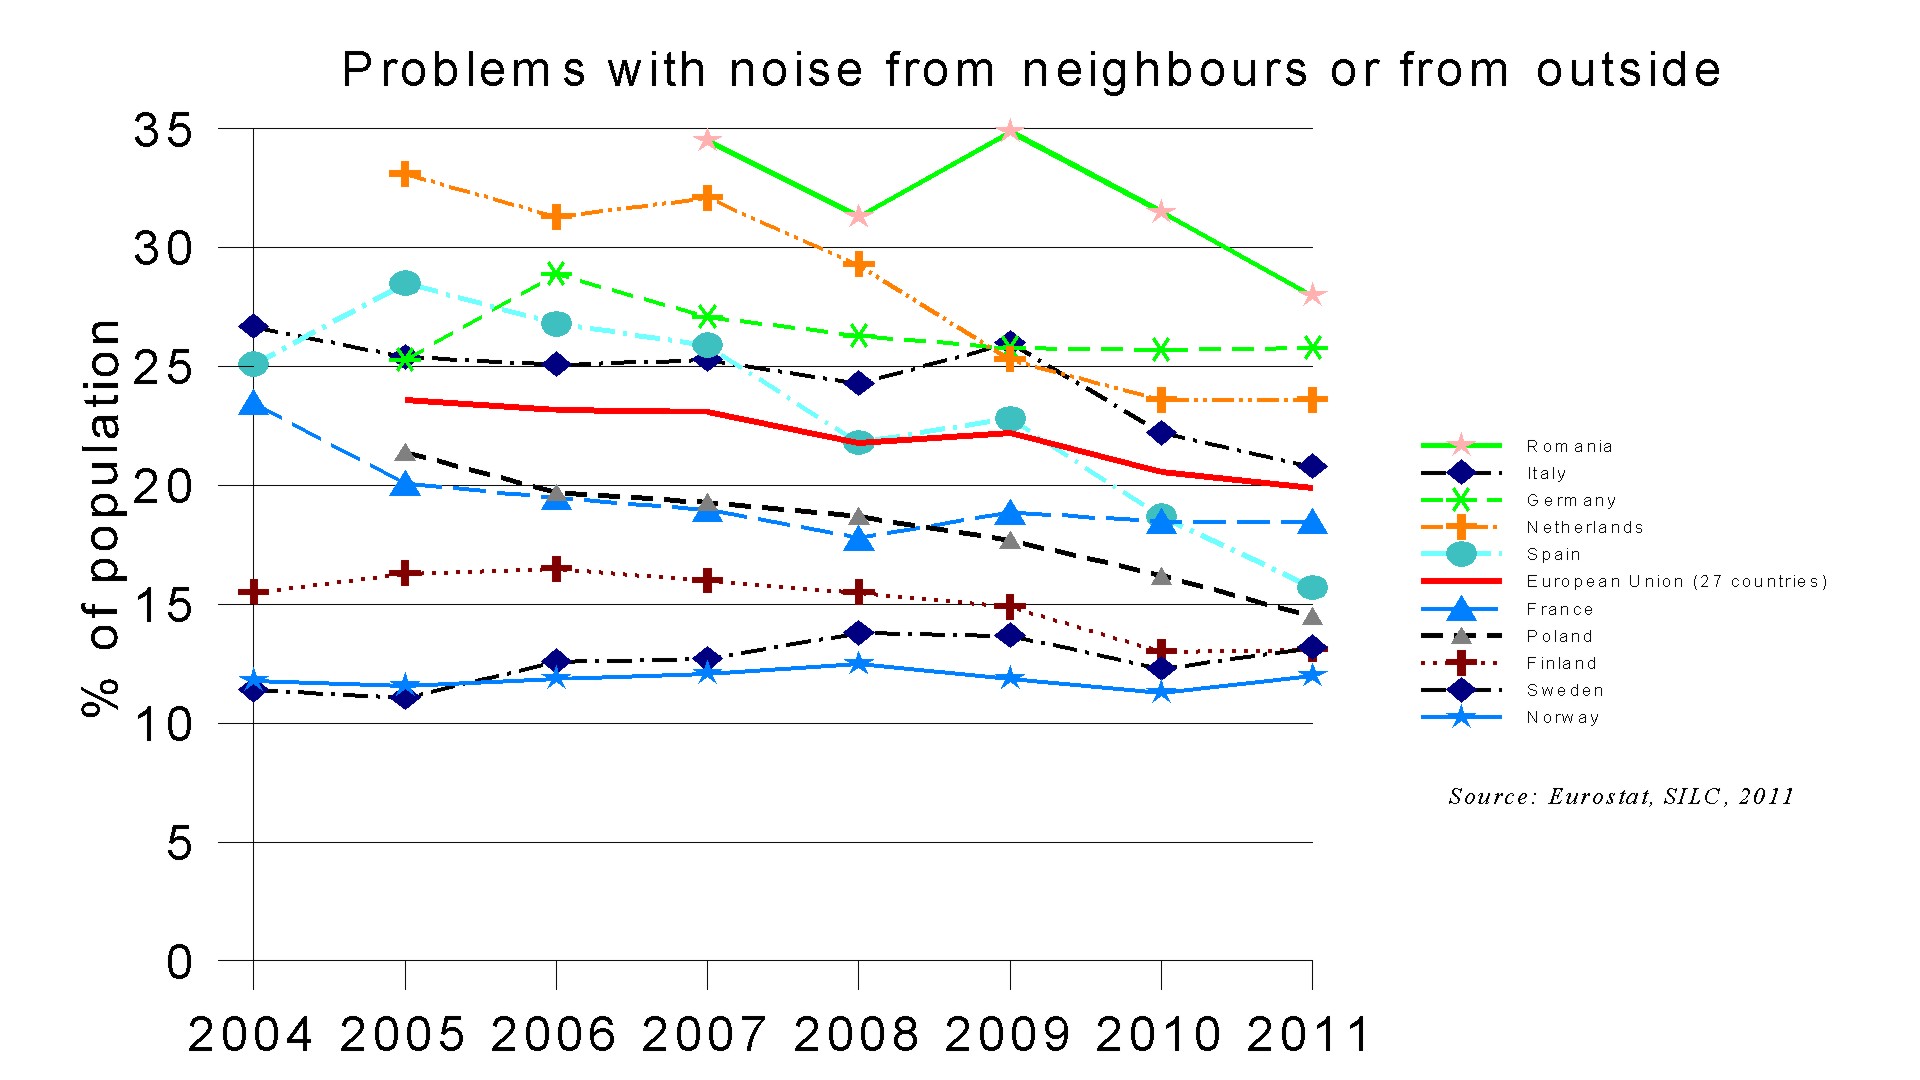
In Groningen (Netherlands) and Oulu (Finland) around 80% would disagree that noise is an issue in their cities, but. in most cities less than half disagrees, down to an amazing 4% in Athens. The enormous differences indicate that there is a lot of room for improvement. That is also apparent form the EUrostat comparisons between member states:
2. Quality judgement and annoyance
In this section 2 important questions are tackled:
- at what sound levels an area is not quiet any more (note: define "level", define "quiet")
- what are additional effects of having additional qa's near by.
Assessing the acoustic quality of an area runs easily into methodological and technical difficulties. As well as for assessing the response as well as for assessing the exposure standards are missing and it is not at all obvious how to do this. The studies that have been done show remarkable convergency . An early example is from 1998:
Visitors in 3 different qa's in the Netherlands were questioned with a reduced series of questions, and the sound levels at the time of questioning were registered. Several indicators were tested for significance (L95, Laeq, Lmax), but there was no clear preference.
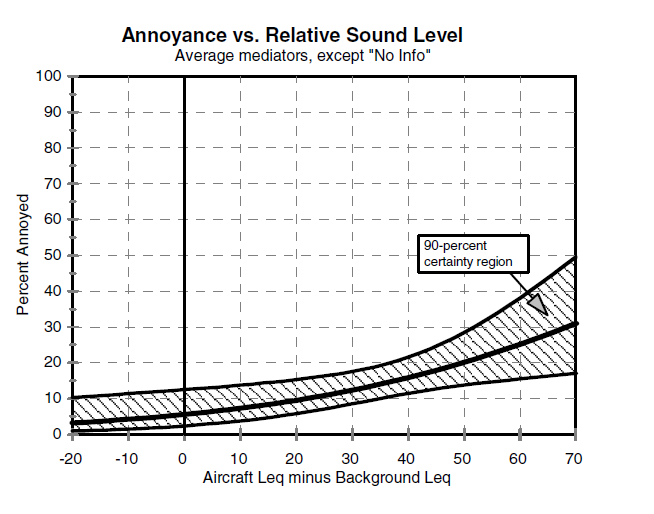
In the well known study by Miller (2001) in US National Parks, this relation between aircraft noise and percent annoyed was found. The background level in these areas was obviously low, around 25-30 dB(A).
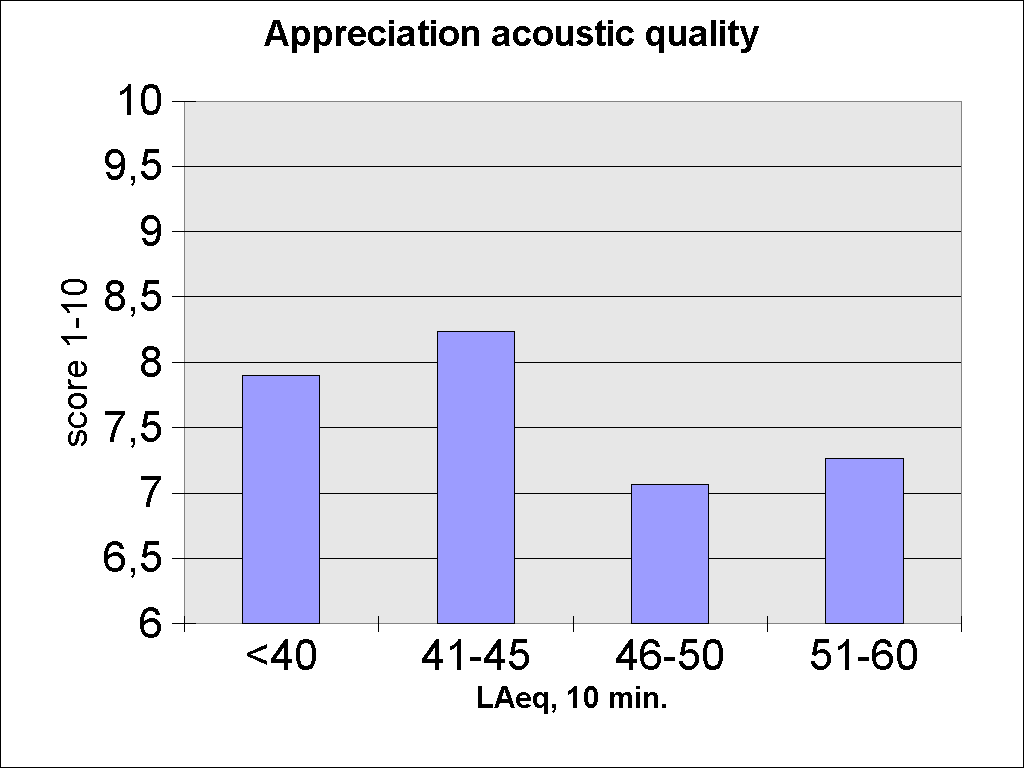
Morinago (2004) found this relation between LAeq in urban parks and annoyance by visitors.
This is a 1 minute LAeq during the visits of the parks.
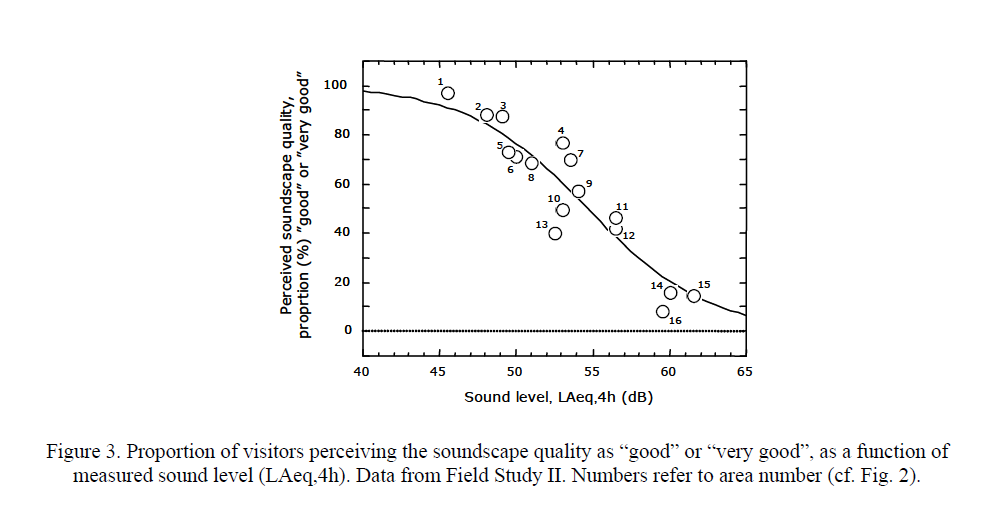
Nillson (2007) found a relation betwen a 4 hr LAeq and "perceived sound scape quality".
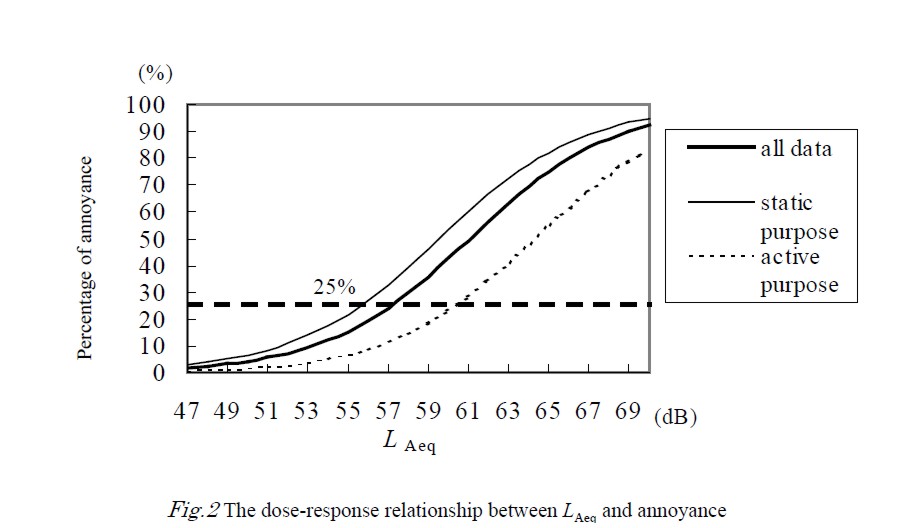
Due to the differences in quality assessments as well as the sound levels only very general conclusions can be drawn. Taking into account that LAeq levels usually correlate well on different time scales it appears that up to ~50 dB(A) acoustic quality is usually found to be good. Between 50 and 60 dB(A) it declines steeply, reaching a decided low quality between 60 and 70 dB(A).
3. Indicators
The END points out that QA's may be selected on the basis of Lden ( ... Quiet Area in agglomeration : shall mean an area, delimited by the competent authority, for instance which is not exposed to a value of Lden or of another appropriate noise indicator greater than a certain value set by the Member State, from any noise source (p. 14)....), but that other indicators can be used if deemed appriopiate. The available evidence as shown does not convincingly lead to indicators other than Lden that are better suited to select quiet areas. Most researchers use a LAeq, although with very different time scales, reaching from 1 minute to 4 hrs. In general it seems that correlations between indicators are much higher than correlations between any indicator and the effect. That makes it for the time being impossible to prefer one indicator over the other if the criteria "prediction of (health) effect" is leading. There are however other criteria when it comes to choosing indicators. The Position Paper on Indicators (1999) lists the following criteria to consider when choosing noise indicators:
1. validity: relationship with effects.
2. practical applicability: ease of calculation from available data, or measurement using available equipment
3. transparency: easy to explain, intuitive, as simple as possible, relationship with physical units, small number of indicators - preferably one.
4. enforceability: use of indicator in assessing changes or when set limits are exceeded
5. consistency: as little difference as possible with current practice
At the present state of knowledge all indicators used in the various studies score equally well (and all weak) on (1), validity, so that doesnot discriminate between possibilities. The Lden scores well on (2) as data is usually available and on (5), but perhaps not too well on (3). The final choice is left to the local preferences.
4. Additional benefits
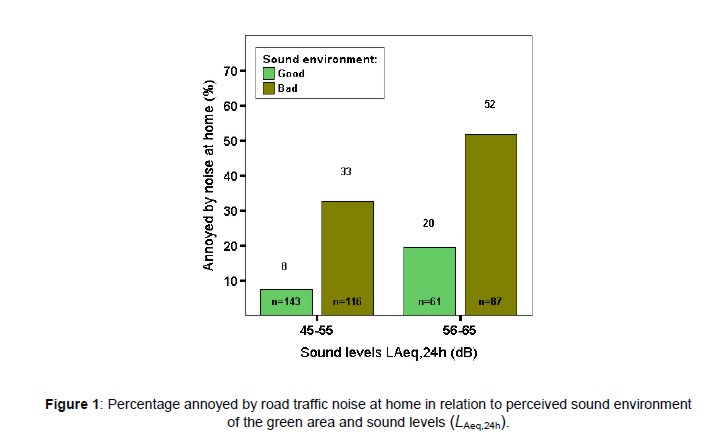
Lastly: what are additional benefits of QA's? Gidlöf-Gunnarsson, A., & Öhrström, E. (2007) showed that people living in residential area with perceived good sound environment are less annoyed.
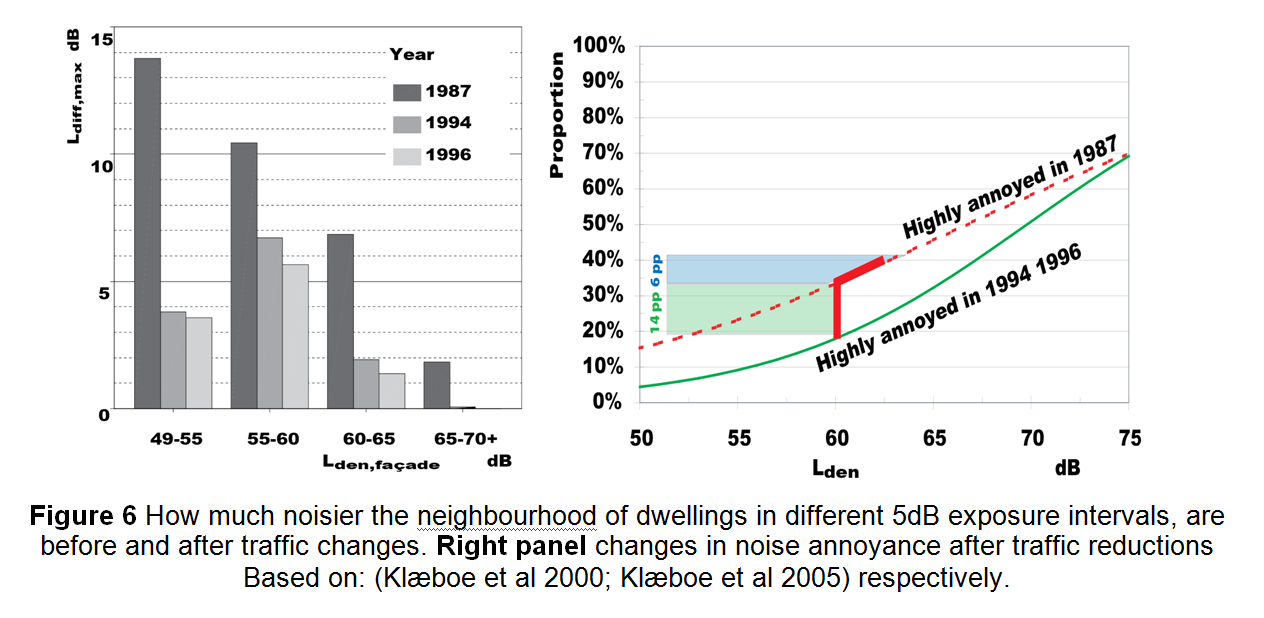
This result is corroborated by earlier studies by Klaeboe (2005 and 2007, synthesized in 2011) which linked annoyance to differences in exposures.
This fits nicely with observations by Kaplan (1995) and the Dutch Health Council (2006) that green areas have positive effects on restoration. It is supposed that acoustic quality of such an area is an essentail element in the restoration process. It is fair to say that hard evidence is lacking for this.